Lab #1
Meet the Equipment
This lab will acquaint you with the essential pieces of equipment you'll be wrestling with all quarter. It is an opportunity to fiddle around with the different controls and learn what each is capable of doing. The equipment involved is as follows:
Oscilloscope (scope)
Digital multimeter (DMM or DVM- digital voltmeter)
Function generator (oscillator)
Breadboard
1) Digital multimeter use: Begin by acquainting yourself with the standalone DMM (Digital Multi-Meter). Use it first as an ohmmeter to verify the resistances of various provided carbon (5% tolerance) resistors. What values are present and how do they compare with the nominal values, determined from the color code on each resistor? Hold the two leads from the DMM so that you make electrical contact, one in each hand. What's your resistance? What's the resistance of you in parallel with a 1MΩ resistor? What are the implications of this for measuring high impedances?
Next, use the DMM to measure voltages. Switch to a suitable DC Volts range and use the DMM to measure the voltages present on the breadboard. (The breadboard must be plugged in and turned on!) The DMM in voltmeter mode measures the potential difference between the two leads: Vred - Vblack. The red lead is conventionally placed at the point of higher potential when making measurements, so that the result is a measurement of the drop in potential (or voltage drop) from the red to the black contact points. Verify the values indicated on the breadboard power supply terminals. Note any discrepancies for future reference. Try using the breadboard's simple built-in DVM (Digital Volt Meter). While not a precision instrument, it works well enough for most purposes and is quite conveniently located. The breadboard also has a built in ammeter. Remember to be careful about how much current you are preparing to stuff through it, without careful thought it's easy to blow these things.
2) Breadboard connections: With the functioning of the DMM under control, try deciphering the grid work of the breadboard, which provides an easy way of building prototype circuits without hours of soldering and unsoldering your mistakes. Don't try to stuff large probes into the smaller sockets on the board; use wire of an appropriate size connected to a BNC cable with miniature spring-loaded grabbers, or jumper wire straight to the breadboard DVM. Once you know where the voltages appear on the breadboard, determine how the grid in the middle is wired up underneath. One way to map out the grid is to apply +5V to a particular location and test with the voltmeter at adjacent or nearby locations to determine where else the +5V appears on the grid. If one of the locations tested shows +5V, it must be electrically connected to the original location where the +5V is applied. If you use the DMM as an ohmmeter instead and attempt to measure directly the resistance between two points on the grid, you must be careful not to connect to a point that is attached to a power supply. The ohmmeter mode of the DMM is not suited to measuring resistances when voltages are present, e.g. in operating circuits. The ohmmeter is useful primarily for measuring isolated (i.e. not in a circuit), passive components. If you're measuring points that may have a voltage present it is wiser and safer to use the voltmeter mode. From your observations, sketch out how the breadboard is connected. Determine what the other components can do.
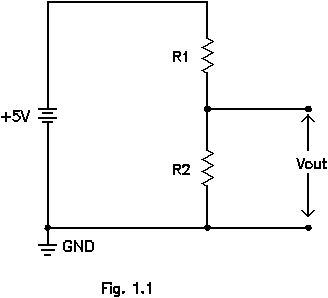
3) Voltage dividers: Now build a voltage divider on the breadboard as shown in fig. 1.1:
Try this circuit with resistor values (again use carbon resistors, not metal film precision resistors): (R1,R2) = (1kΩ,1kΩ) (10kΩ,10kΩ) (1kΩ,10kΩ)(10kΩ,1kΩ) (1MΩ,10kΩ) (1MΩ,1MΩ).
Prepare a table comparing the observed value of Vout measured with the DMM with the expected value. (How is the expected value calculated?) Comment on any differences between measured and expected values. Next, incorporate a potentiometer (“pot”, this is a variable resistor, they are blue oblong components with a screw on one end) into a voltage divider, using the pot to replace the lower resistor in the original circuit with R1=10kΩ. Use the pot as the output connection. Draw a schematic for your circuit and indicate the range of output voltage available as you adjust the pot from one extreme to the other. What does this tell you about the specifications of the pot you are using, such as minimum and maximum resistance, and the step size of the resistor as you adjust the potentiometer?
4) Oscilloscope: Now turn your attention to the oscilloscope and function generators, both stand-alone and built into the breadboard. Find out how to manipulate the amplitude and frequency of the output of the function generator and figure out how to observe the results on the scope. First, get a sine wave with an approximate frequency of 1kHz. Adjust the amplitude to 1 volt (2V peak-to-peak). Once you've got something visible on the scope, experiment with the horizontal and vertical position controls. Determine the effects of the vertical sensitivity and timebase controls. Also familiarize yourself with the triggering controls, especially the auto, internal, and line modes. Record the effect of these controls and the trigger level and slope options as well. These digital scopes are menu driven, find the items mentioned above in the menus and get familiar with how they work.
Disconnect the function generator and use yourself as the input (you're an antenna), holding the input leads to the scope, one in each hand. If you have difficulty obtaining a stable pattern, try using "line" triggering. What do you observe? Sketch it quantitatively. From the oscilloscope data find the dominant frequency. Where might it come from?
Next explore the input coupling switch options on the input channel menus. Set the option to ground (GND) and center the trace vertically on the display. This sets the 0V position on the scope display and establishes the origin for the y-axis. Switch to DC coupling. Observe and quantitatively sketch the oscilloscope trace for both a sine wave and square wave for frequencies from 1Hz to 1MHz, stepping through the frequencies in decades (i.e. by factors of 10). Repeat for AC coupling. Compare the results for AC and DC coupling.
Return to the voltage divider circuit of part (3) using the function generator (1kHz, 1V amplitude) as the input to the voltage divider. Use the scope (input dc coupled) to measure both Vin and Vout simultaneously. Make use of both input channels on the scope and show both traces at once. Use (R1,R2) = (1kΩ,1kΩ) (10kΩ,10kΩ) (1MΩ,100kΩ) (1MΩ,1MΩ). Again report the amplitude of the measured peak-to-peak input and output voltages as well as the expected output value based upon the measured input value. Repeat these measurements using ac coupling at the scope input to measure Vout. Compare the observed results to expected values again. Can you explain any differences? What is the significance of the "input impedance" of the measuring device in these measurements?