 Electronic
symbol
Electronic
symbolLab #3
Introduction to Diodes
The diode is the first non-linear devices we'll be working with in circuits. It is a non-linear device in that one cannot write down a simple, linear relationship between current and voltage, as one does for resistors with Ohm's law. The current flowing through a diode is not simply proportional to the potential difference across its terminals, instead the current rises exponentially with the potential difference. Diodes have a “resistance” that depends on the magnitude and polarity of the applied voltage. The best one can do is to refer to the dynamic resistance of diode, dV/dI, which is large for negative or small voltages and drops rapidly as V is increased. In the crudest (and perhaps most useful) sense, diodes allow current to flow in one direction only. Diodes act like a one-way or “check” valve for current.
 Electronic
symbol
Appearance of real device
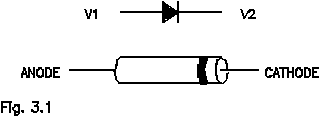
V1 > V2 = Forward biased; current flows; “on” state, small dynamic resistance
V1 < V2 = Reverse biased; (almost) no current flows; “off” state, large dynamic resistance
1) Preliminary tests: You have two “unknown” devices (a resistor and a diode, to provide a spoiler). Begin with a quick qualitative check by measuring their resistances with the DMM as an ohmmeter. Be sure to reverse the leads (and therefore the polarity of the measurement) and record any differences as well as the range of the meter used to make the measurement.
 2)
Resistor I-V: Set up to measure the I-V (current-voltage)
characteristics of both devices more carefully. Begin with the one
you believe to be an ordinary resistor. A basic circuit for this
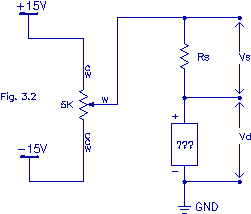
(mind the polarity) is shown in Fig. 3.2. The I-V measurement
can be made by using the DMM to measure Vd (the
voltage drop across the unknown device) and Vs (the
voltage drop across the series resistor). Then I = Vs/Rs.
Make a plot of I (the ordinate) vs. Vd (the
abscissa) for the device for -1.0V < Vd < 1.0V.
Take enough data to make a reasonable plot of I as a function
of Vd. Obtain nearly equally spaced values of Vd.
It helps to make a crude plot of your data as you take it in order
to see if some region should be measured more carefully. What value
of Rs proves to be most convenient in the
measurement? By adjusting the potentiometer, you should be able to
measure both forward-biased (Vd > 0)
and reverse-biased (Vd < 0)
conditions. From the slope of the graph of I(V) determine the
resistance of the unknown resistor.
3) Diode I-V: Now try the other unknown device, tentatively identified as a diode, in the circuit. Again, mind the polarity. Measure and plot the I-V curve for it. Take enough data to show its behavior accurately. You may find that you need to adjust the value of Rs used in order to get sufficient resolution of the current when it is reverse-biased and to not be limited by other components when forward-biased. Think about what's going on in this circuit carefully when making the measurements. Measure out to at least Vd = 0.6V in the forward-biased direction and to -1.0V in the reverse-biased direction.
A simple model for the diode's operation leads to a convenient functional form for I(V):
![]()
Here q is an effective charge comparable to e, the magnitude of the electronic charge; T is the absolute temperature; and kB is Boltzmann's constant. For situations where V > 0 and qV ≫ kBT, the exponential is the dominant contribution and the "-1" term may be neglected. When the diode is strongly reverse-biased, so that V < 0 and |qV| ≪ kBT, the current is independent of V: I -Io. Use these considerations and a plot of ln(I) as a function of V from your collected data to determine Io and q for your diode. Express q as a multiple (or fraction) of the electron charge, e.
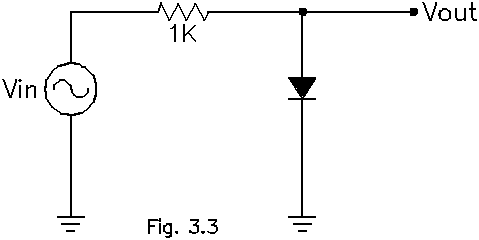
4) Clipping circuit: Build the circuit indicated in Fig. 3.3. Compare Vout to Vin. Describe the effect of the diode. What happens if you increase or decrease the amplitude of the signal from the oscillator? Make quantitative sketches of what you observe for Vin = 5, 2, 1, and 0.5V peak-to-peak @ 1kHz. You may need to build a voltage divider to achieve the smaller amplitude signals.

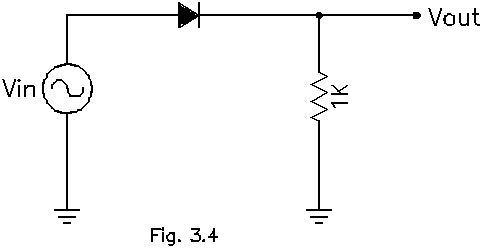
5) Half-wave rectifier: Make similar measurements for the circuit in Fig. 3.4 as in (4). Again make quantitative sketches of Vout compared to Vin. Describe the effects of the diode.
