MINOS:
VME Rack Protection System
Help
Documentation Guide
By: Alec Habig, Garrett McKelvey and Jason Koskinen
|
Contents |
|
-
Initializing network settings on RPS |
|
iFix – Using the VME Rack
Control System |
|
-RPS |
Section 1: RPS - Basic Instruction
The Rack Protection System (RPS) is an alarm system which monitors the condition of various parameters in the MINOS VME racks via various sensors (such as heat, humidity, voltage, etc.). The RPS sends and receives data by ethernet to the central DCS iFix Server. This section will describe the functions of the RPS and how to control it.
Status Lights
There are three status lights on the front panel of the RPS:
Alarm, Warning, and
When the normal light is active by itself, everything is running under normal conditions.
If normal is accompanied by the alarm or warning lights, an alarm/warning was tripped and has not been acknowledged, but the current state is normal.
If alarm or warning is activated and normal is not, there is currently a problem. You will not be able to control the RPS while in this status, with exception to the alarm silencer.
Controls
The RPS has five buttons located on the front panel: Smoke Detector Reset, Relay Reset, Output Reset, Clear Display, and Alarm Silence. Here is what each button does:
Smoke Detector Reset: Resets smoke alarms after they are tripped.
It also simulates a smoke detector alarm. Acts like a test button for the RPS system. The button will engage the alarm light (which must be reset manually), trip the AC power relay, and activate the alarm horn (which shuts off automatically once the button is released).
Relay Reset: The RPS
controls an AC power relay which cuts the power to the rack if an alarm is
activated. The relay reset button will
turn the power back on. However, the
power will only return permanently if the
Note that when the unit is first turned on, the AC power to the rack is off, and thus all the parameters being monitored are out of range – causing an alarm state. This Relay Reset button must be held down while all the equipment in the rack turns on. When the rack is successfully powered up, press the Output Reset and Clear Display, and release the Relay Reset button to resume normal operation.
Output Reset: This button
will reset the data bits to be sent to the computer (indicating that everything
has returned to normal), provided the RPS is under
Clear Display: This button will turn off the alarm and warning lights, provided the RPS is under normal status.
Alarm Silence: This button turns off the alarm horn, unless another alarm is activated. This can be used under any RPS alarm status.
Jumpers
If you look at the top panel of the RPS, you will see three rectangular holes. If you look inside the holes, you will see many small metal prongs (“jumpers”), identified by a number on the circuit board and a corresponding label on the panel itself. Some of these jumpers will be covered by a small, red, plastic thing with a copper bridge, thereby allowing current to pass between the prongs.
Each of the prongs corresponds to an individual sensor. When bridged, the RPS will pay attention to that particular sensor. Without the bridge, the RPS will ignore that sensor.
Knowledge of the jumpers comes in handy if you are testing a sensor and the RPS doesn’t give a response. For example, say we wanted to test the air temperature sensor, are able to burn our fingers by touching the sensor, and the RPS doesn’t care - then there is something obviously wrong. One thing to remember is to make sure the jumper that pays attention to the air temperature is bridged.
[Side note: the temperature sensors should not be allowed to heat up to a temperature able to burn you, the maximum temperature exposed to these sensors should only be 55 degrees Celsius.]
The flip side of using this knowledge is if an alarm is active and you can’t tell what is wrong. If the problem obvious, then you can always manually pull off the bridges one at a time until the alarm shuts off, then look at the corresponding label to determine the problem. Granted this is not an efficient or convenient way of finding out what is wrong. This method works, however it should only be used as a last resort.
Port/Bit Assignments
The RPS communicates to the computer through a four 8-bit ports, with each sensor assigned a bit. Below is a chart indicating the Port/Bit assignments that the RPS uses:
|
Port |
Bit |
Assigned Property |
|
Port |
Bit |
Assigned Property |
|
0 |
0 |
Main Alarm |
|
2 |
0 |
VmonID_bit2 |
|
0 |
1 |
Main Warning |
|
2 |
1 |
Airflow Out Alarm |
|
0 |
2 |
Vmon Alarm |
|
2 |
2 |
Air Temp Diff. Alarm |
|
0 |
3 |
Vmon Warning |
|
2 |
3 |
Water Leak Alarm |
|
0 |
4 |
External Alarm |
|
2 |
4 |
Air Temp Warning |
|
0 |
5 |
Smoke Alarm |
|
2 |
5 |
Relative Humidity Warning |
|
0 |
6 |
VmonID_bit0 |
|
2 |
6 |
VmonID_bit3 |
|
0 |
7 |
Fan Failure Warning |
|
2 |
7 |
Air Flow In Alarm |
|
1 |
0 |
Water Flow Warning |
|
3 |
0 |
Alarm Silence |
|
1 |
1 |
Water Flow Alarm |
|
3 |
1 |
Clear Display |
|
1 |
2 |
Water Temp Warning |
|
3 |
2 |
Output Reset |
|
1 |
3 |
Water Temp Alarm |
|
3 |
3 |
Smoke Detector Reset |
|
1 |
4 |
External Temp |
|
3 |
4 |
Relay Reset |
|
1 |
5 |
Air Temp Diff. Warning |
|
3 |
5 |
SYSRESET* #1 |
|
1 |
6 |
VmonID_bit1 |
|
3 |
6 |
SYSRESET* #2 |
|
1 |
7 |
Air Temp Alarm |
|
3 |
7 |
SYSRESET* #3 |
Ports 0, 1, and 2 are the bytes which the RPS outputs to the computer. Port 3 bits are RPS inputs. You will need to use this chart when setting up the EDAS driver to communicate to the RPS. Detailed explanation will be provided in RPS/EDAS Configuration section.
The RPS also sends bits to the RPS to specify any voltage channels that are deviating from normal. The RPS does this through the VmonID_bitX bits. These bits form a ½ byte word encoding the troubled channel. Below is a table indicating what each ½ byte stands for:
|
0000 |
+3.3Vdc "Under Voltage Failure" |
|
0001 |
+5Vdc "Under Voltage Failure" |
|
0010 |
+12Vdc "Under Voltage Failure" |
|
0011 |
-12Vdc "Under Voltage Failure" |
|
0100 |
+6Vdc "Under Voltage Failure" |
|
0101 |
-6Vdc "Under Voltage Failure" |
|
0110 |
+5Vdc PDB box "Under Voltage Failure" |
|
0111 |
-5Vdc PDB box "Under Voltage Failure" |
|
1000 |
+3.3Vdc "Over Voltage Failure" |
|
1001 |
+5Vdc "Over Voltage Failure" |
|
1010 |
+12Vdc " Over Voltage Failure" |
|
1011 |
-12Vdc " Over Voltage Failure" |
|
1100 |
+6Vdc " Over Voltage Failure" |
|
1101 |
-6Vdc " Over Voltage Failure" |
|
1110 |
+5Vdc PDB box " Over Voltage Failure" |
|
1111 |
-5Vdc PDB box " Over Voltage Failure" |
[Note:
The ½ byte sent out will be ‘0000’ if the RPS alarm status is either normal
or +3.3Vdc Under-Voltage Failure.] ■
Section 2: RPS Installation
Attaching RPS to the VME Rack
Please see the VME Rack Installation guide for instructions on assembling and populating the racks themselves. To install the RPS and its sense wires:
- Put the RPS on a table next to the rack. It is easier to test it there than in situ. Once things work, unplug the cables, install it in the rack, and plug the cables back. See below for which cables go where in the RPS.
- Attach the +/- 12, + 5, and + 3.3V and their return lines to the lugs where the power cables enter the VME rack. The RPS cables are labeled. Route the RPS cables up from below so as not to interfere with the power leads coming down from above. The large bolts are 17mm, the small 10mm – use a socket and ratchet with an extension. The bolts have a washer, the power lead ring, and finally a brass washer (see figure). The sense wire ring should be placed between the outer washer and the power lead ring, so that the current flowing into the crate does not have to pass through the sense wire ring. Reattach the bolts firmly, but be careful that the various rings attached to the bolts do not twist so that they go sideways into their neighbors.
- Attach +/- 6V sense cables to the lugs where the power supply leads attach to the bottom backplane of the VME crate. It is easier if you remove the 6V power supply from the face of the rack at this point. The RPS cables are labeled. Route them up from below to keep them out of the way of the backplane. The red power wire is +6V, the brown –6V, and the black is the common return. Both RPS sense wire returns attach to this same lug. Tools needed: a phillips screwdriver and much patience, as the rear VME card guide rails are right in the way of the screws (taking out these guide rails is worth it). The rings on the end of the RPS sense wires are a very tight fit on the screws. This comes in handy for trying to screw things back in with only two hands – but as a result be sure to tighten the screws firmly into place. Also note that the 6V power supplies are calibrated to provide 6.00V with no load. A full VME crate will cause the +6V line to droop to 5.77V, and the –6V line to droop to –5.92. Taking apart the power supply and turning up the delivered voltage to compensate for this droop is a Good Idea.
- Attach the Fan Failure leads to the back of the fan tray. The red wire goes to the “+” screw, the black to the “-“ screw, and the ground braid goes to one of the unlabelled screws. This is to ground the cable’s shielding, it does not connect to chassis ground on the other end. After this is complete, reattach the 6V power supply to the rack.
- Plug the round, threaded end of the AC relay control cable to the socket on the AC relay box.
- Mount the two air flow sensors.
- The output air sensor board should be attached to the left wall of the VME crate, above the 6U sub-crate. Use two 1” bits of Velcro tape, one on each end of the board on its back side, to attach the sensor to the wall. Attach the control cable to the sensor board and the RPS unit.
- The input air sensor board is attached to the VME crate wall in the plenum underneath the 6U sub-crate, using the same Velcro method. You will have to remove the fan tray to access this plenum from below.
- Mount the two smoke detectors.
- Cut the BiRa supplied cable tie. Attach a “4-square hole mount” (from the front of an electrical box, 4.125” square, two mounting holes 2.75” apart, with a ½” rise) using two 8/32 ½” screws to the bottom of the first smoke detector in the chain. Cable tie the wires to the corner of the hole mount for strain relief. Cut four 1.5” lengths of Velcro tape, attach one side to the corners of the hole mount, and trim any overlap. Put the other side of the tape on the first side, peel the covers off the sticky stuff, and stick the whole unit in the middle of the bottom of the LI box. Avoid covering the LI ventilation holes.
- Cable tie the second smoke detector to the bottom of the cable tray, above the back edge of the VME rack.
- Plug the two power strips into the AC relay box, and plug the WEINER power supply 208V cable into the AC relay box. Plug the AC relay box’s two power cables into the wall. Plug the RPS box’s power cord into the wall (but not yet the relay box).
- Plug the various RPS cables into the RPS box (see below). Power up the RPS unit, holding down the Relay Reset button until everything comes online. Troubleshoot. Verify that the DCS computer can communicate with the RPS box via ethernet.
- When things work, disconnect the cables. Install the RPS in the uppermost part of the rack. Reinstall cables, being sure to use the strain relief bar. Power things up again, rejoice when it works.
Cable/Sensor Setup
The following steps are written so you can attach the cables starting from the right port to the left port, assuming you are looking at the back of the RPS. When attaching the cables, please pass them through the strain relief bar at the back of the RPS unit, and clamp it down upon the cables whence complete. This protects the cable connections from being yanked funny and shorted out.
1.) Attach the [+12/-12/+5/+3.3] Voltage Monitor Cables to Port J2.
2.) Attach the [+6/-6] Voltage Monitor Cables to Port J3.
3.) Attach the Ethernet cable to the
4.) Attach the Fan Failure Sensor cable to J6.
5.) Attach Smoke Detector cables to J5.
6.) Attach H2O sensor cable to J1 (not present on far detector racks).
7.) Attach Output Airflow Sensor cable to port J9.
8.) Attach Input Airflow Sensor cable to port J8.
9.) Attach the Female Harvard PDB cable to the Male DB9 port.
10.) Attach the Male Relay cable to the Female DB9.
11.)
Attach the 120 V power cable to the power cable port. ■
Section 3: RPS/EDAS Configuration
This section provides instruction on how to configure the Ethernet Data Acquisition System (EDAS) driver to communicate to the RPS.
Initializing network settings
on RPS
Once the EDAS configuration software is installed on the computer, turn off the RPS power, and attach a null-modem serial cable from the computer to the RPS. Turn the RPS back on, and run EDAS Syscheck 3.0. Make the screen look like this:
Note: Make sure every RPS you install has a different IP
address; other settings may be the same.
Never adjust the “Ethernet Address” field. The map of the DCS subnet settings can be
found at http://neutrino.d.umn.edu/~numi/dcs-lan2.txt
After entering the desired settings, click on the Program tab. Then
select the COM port that is attached to the RPS. Then click the ‘Attach to
EDAS’ command button. If all goes well,
click the first three ‘Write…’ command buttons.
If you get an error that says “Error opening serial port. Verify that the selected port actually exists on the system.”, verify that the correct port and serial cable is being used.
After the EDAS network settings are configured, restart the RPS, and you are ready to begin testing.
Testing the EDAS driver
Click on the Test tab. Click on the Perform Digital I/O Test command button. This is the only button that will be used to test the RPS, there are no analog I/O on this unit. This screen will pop up:
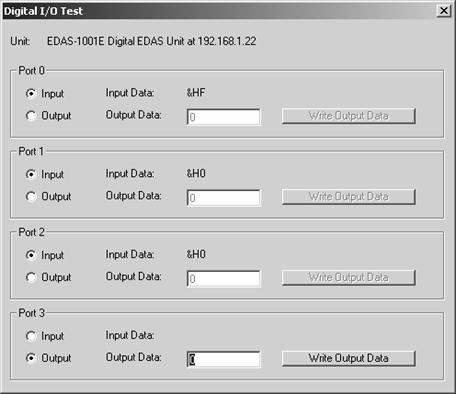
Make sure Ports 0 thru 2 are set to input, and that
Port 3 is set to output. This
corresponds with the Port/Bit assignments indicated on page 2 (you can only
send with port 3, receive with 0 thru 2).
To test that EDAS and the RPS are working properly, send various
commands by typing a bit number on Port 3, then by pressing the Write Output
Data command button. The data on each port corresponds to eight bits
expressed as a hexadecimal word, such as the &HF seen as the input
data for Port 1. [Note: When
reading hexadecimal codes, drop the &H]
Understanding Hexadecimal Code
Hexadecimal code is a short way of representing 8 digit binary numbers. Each digit in hexadecimal code represents four digits in binary. Instead of just using 1s and 0s as binary code does, hexadecimal uses 0 through 9, and a through f. In order to translate an alphabetical character of a hexadecimal number, you must translate the letter into a decimal number, and then figure out the binary value. Here is a chart of fundamental hexadecimal values translated into decimals:
|
0 |
1 |
2 |
3 |
4 |
5 |
6 |
7 |
8 |
9 |
a |
b |
c |
d |
e |
f |
|
0 |
1 |
2 |
3 |
4 |
5 |
6 |
7 |
8 |
9 |
10 |
11 |
12 |
13 |
14 |
15 |
Here is an example of how to change hexadecimal into binary.
This is just an example; you won’t actually ever see a value like this in EDAS. Let’s now use a working example. The screen print on page 4 indicates a value of HF; let’s figure out what is going on. We can ignore the H, because that is just a label telling us the value is in hexadecimal.
Because the RPS communicates
using eight bits, and the hex code only
gave us four bits, we have to put four 0’s in front of the translated binary
value.
Now you have to find out what
that binary number is trying to tell us.
Since each bit value represents a signal that is activated, we have to
find out what these signals are. To put it in perspective, look at the table
below using the binary number we derived above.
|
Bit Number |
7 |
6 |
5 |
4 |
3 |
2 |
1 |
0 |
|
Binary Number |
0 |
0 |
0 |
0 |
1 |
1 |
1 |
1 |
Bit numbers 0, 1, 2, and 3
are activated, and remember that these values were given to us through Port 0.
All you need to do now is take a look at the following Bit/Port Assignments
(also on page two):
|
Port |
Bit |
Assigned Property |
|
0 |
0 |
|
|
0 |
1 |
Main Warning |
|
0 |
2 |
Voltage Alarm |
|
0 |
3 |
Voltage Warning |
|
0 |
4 |
External Alarm |
|
0 |
5 |
Smoke Alarm |
|
0 |
6 |
VmonID_bit0 |
|
0 |
7 |
Fan Failure |

To conclude, HF means that something is wrong with the voltage. Keep in mind that the main alarm will trip if any alarm trips, and likewise with warnings.
Installing the Jumpers
Here is a list of the jumpers that need to be added once the RPS is programmed with its IP address and all the cables are properly attached to the various places on the rack. From the top here it goes…
|
|
J20-AIRFLOWIN WARN |
|
X |
J21-AIRLFOWIN ALARM |
|
X |
J14-AIRTEMP WARNING |
|
|
J13-HUMIDITY WARNING |
|
X |
J15-AIRTEMP ALARM |
|
|
|
|
X |
J16-AIRTEMPDIFF WARN |
|
X |
J17-AIRTEMPDIFF ALARM |
|
|
J22-H20LEAK ALARM |
|
|
J18-AIRFLOWOUT WARN |
|
X |
J19 AIRFLOWOUT ALARM |
|
|
J25-H2OTEMP WARN |
|
|
J26- H2OTEMP ALARM |
|
|
|
|
|
J23-H2OFLOW WARN |
|
|
J24-H2OFLOW ALARM |
|
|
|
|
|
J75-RACKPOWER ALARM |
|
|
J76-EXTERNAL ALARM |
|
X |
J77-SMOKE ALARM |
|
|
J68-C3V3AL |
|
|
|
|
|
J69-C3V2WH |
|
|
|
|
|
J67-C3V3WL |
|
|
|
|
|
J70-C3V3AH |
|
|
|
|
X* |
J72-C3V4AL |
|
|
|
|
|
J73-C3V4AH |
|
|
|
|
X* |
J71-C3V4WL |
|
|
J52-5V EXT LOWALARM |
|
|
J74-C3V4AH |
|
X |
J53-5V EXT HIGHWARN |
|
|
J59-C3V1WL |
|
X |
J51-5V EXT LOWWARN |
|
|
J62-C3V1AH |
|
X |
J54-5V EXT HIGHALARM |
|
|
J60-C3V1AL |
|
|
J56- -5V EXT LOWALARM |
|
|
J61-C3V1WH |
|
X |
J57- -5V EXT HIGHALARM |
|
|
J63-C3V2WH |
|
X |
J55- -5V EXT LOWWARN |
|
|
J66-C3V2AH |
|
X |
J58- -5V EXT HIGHALARM |
|
|
J64-C3V2AL |
|
X |
J43-6V LOWWARN |
|
|
J65-C3V2WH |
|
X |
J46-6V HIGHALARM |
|
|
|
|
|
J44-6V LOWALARM |
|
|
J36-12V LOWALARM |
|
X |
J45-6V HIGHWARN |
|
X |
J37-12V HIGHWARN |
|
X |
J47- -6V LOWWARN |
|
X |
J35-12V LOWWARN |
|
X |
J50- -6V HIGHALARM |
|
X |
J38-12V HIGHALARM |
|
|
J48- -6V LOWALARM |
|
|
J40- -12V LOWALARM |
|
X |
J49- -6V HIGHWARN |
|
X |
J41- -12V HIGHWARN |
|
|
|
|
X |
J39- -12V LOWWARN |
|
|
|
|
X |
J42- -12V HIGHALARM |
|
|
|
|
|
J27-5V LOWALARM |
|
|
|
|
X |
J30-5V HIGHWARN |
|
|
|
|
X |
J28-5V LOWWARN |
|
|
|
|
X |
J29-5V HIGHALARM |
|
|
|
|
|
J31-3.3V LOWALARM |
|
|
|
|
X |
J34-3.3V HIGHWARN |
|
|
|
|
X |
J32-3.3V LOWWARN |
|
|
|
|
X |
J33-3.3V HIGHALARM |
|
|
|
Note
that for the far detector racks the H2O alarm and warning are pulled
because there is no water to cool the equipment, for the near detector racks
these jumpers will have to be installed. The airflow warnings are not used
because those bits were used for voltage monitoring. To allow people to work on the electronics in
the crates without killing the power, all the “Low” voltage alarms are not
installed. A warning will still be
generated if you turn off a power supply, but power will not be cut by causing
an alarm. If for some reason the RPS
that you are installing/fixing has a different arrangement of jumpers than the
diagram above put the appropriate jumpers in according to the names and
warnings next to the jumper location, not the diagramed location from above. ■
* The J72 & J71 jumpers activate monitoring of the -12V line internal to the RPS, the so-called “F2 Fix”. If the F2 fuse blows and the RPS doesn’t have the voltage it needs to monitor temperatures and airflows, we would like to know about it, and these jumpers will cause it to trip. Note that some older units use the JXX & JYY jumpers to activate this instead.
Section 4: iFix – Installation
To install iFix onto a computer be sure to have the appropriate IIE driver, you can find this file on the Internet: neutrino.d.umn.edu/~numi/Files/fix2.5.zip
Unzip the file into a known directory on the local hard drive (i.e. c:\Drivers\iie\ )
1.) Begin the installation of iFix, insert the iFix CD and run the setup file.
2.) When prompted, use the custom installation procedures as opposed to automatic (normal).
note: custom installation allows you to install the IIE Driver. THERE IS NO OTHER WAY TO INSTALL THIS DRIVER AFTER INSTALLATION!
3.) Run setup as you would with any other program, until it prompts you for an external driver using a floppy disk.
4.) Indicate you want to install a driver, it will try to access the floppy drive, then complain to you. Just hit the 'browse' button and look for the driver in the IIE directory that you made earlier.
5.) The IIE Input/Output Driver should install, then iFix will continue its installation until complete.
6.) Once finished, reboot.
After installation you need to:
1.) Setup the SCU.
2.) Setup the block database.
3.) Test, Test, Test.
Section 4: iFix – Basic Instruction
iFix is an industrial automation program used to control a variety of equipment and machinery through a graphical user interface. It integrates it’s own design form called a picture, and incorporates VBA to allow you customize and create your own interface. It also uses SQL to create databases which record alarm events, et cetera.
iFix takes a while to get used to, but this guide will serve as a starting point to help you understand. Also, if you are not going to be an iFix picture developer, then skip to Section 6: Using the VME Rack Control System.
The first thing to do is activate the iFix startup program, this will initialize subprograms needed to run the workspace, databases, and so forth. (Make sure EDAS is NOT running at the same time!)
Making pictures and creating objects.
Once you started iFix, run the Intellution Dynamics Workspace (this may auto-start upon launching iFix). The workspace is going to be the main program you use. It has two sections: the system tree and the picture. The system tree is a summarized version of a file system like Window’s Explore program. Don’t worry about all the directories yet, just pay attention to the Pictures directory.
Make a new picture by clicking on File > New > Picture in the menu.
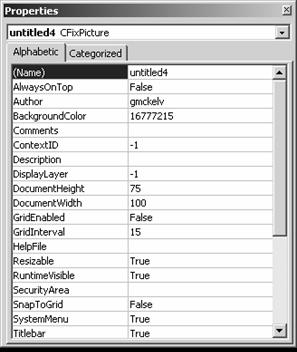
You can change the name of the picture a couple different
ways. The best way is by expanding the picture folder in the system tree, and
right-click on the name of the untitled picture. Then click Property
Window…
Keep in mind; this property window is a Visual Basic property window. To change the name, simply change the name property and press enter.
Now on to creating objects. First, make sure you have the necessary toolbar to do so. There should be a square box with about 54 icons in it, named Toolbox. If this is not visible, go to the menu and click Workspace>Toolbars…
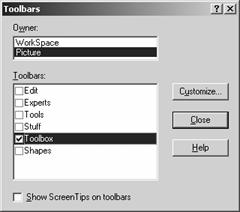
Then make the screen look like this one.
The toolbox is just a malage of all the icons you will use the most often. Feel free to select other boxes as they provide more functions, but aren’t used often.
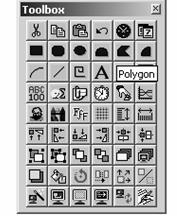
After you close the toolbars screen, you’ll be back to the workspace with the icons you need to get started. So, make an object like a square, or label, et cetera, by clicking on the appropriate icon, then click and drag on the picture, and release to create the actual object.
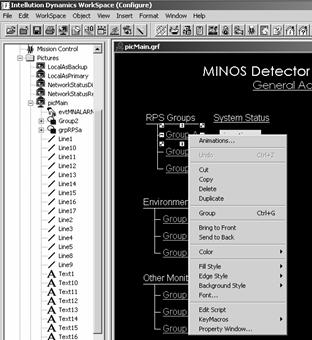 After
you have an object, right click on it to pull up another menu. As you can tell, there are many things you
can do. Here are just a few things:
After
you have an object, right click on it to pull up another menu. As you can tell, there are many things you
can do. Here are just a few things:
Animations: will change the properties according to different data values.
Group: will put multiple selected objects in one group, which can lighten up on code and make moving things around easier (best to move one object rather than 20 small lines)
Edit Script: will pull you over into the VBA code for this object.
Property Window: changes VBA properties.
There is also a grid settings window which allows you to adjust grid properties, making things easier to align. You can access the screen by clicking on Format>Grid Settings in the menu.
iFix sub-programs
iFix uses a number of programs, this subsection will point out these programs and indicate what they do.
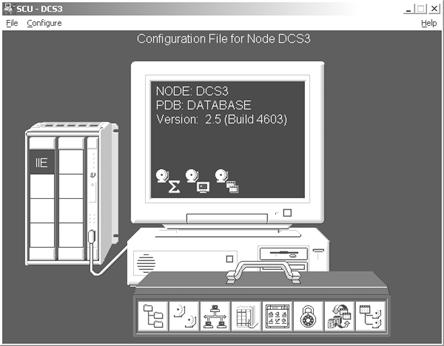
System Configuration Utility (SCU): This
program is used to create and modify the driver, SQL, alarm, network, and
security configurations. It also stores the SCADA database which houses all of
the input/output address info which you will need later. Whenever iFix
communicates with an external device like the RPS, it runs through the SCU, so
it is a very important program.
Historical Assignment: Not currently used.
Database Manager: This is a “block” database. Blocks are iFix entities that have one Port/Bit (I/O address) which it communicates. This is how we actually get iFix pictures to send or receive commands from a device.
Alarm
History: Just a program that displays the most recent alarm events. It also records SQL and comm errors. ■
Section 5: iFix - RPS Setup
Setting up an RPS requires an understanding of how iFix communicates to
external devices. The following illustration should simplify explaining how
this is done.
Configurating iFix for RPS Communication
As you can see from the above diagram, iFix uses a
complicated way to connect with a device.
The EDAS Driver is already installed onto the iFix system, it’s alias in
iFix is “IIE,” which you can see from the SCU. The two things which you need to
configure are the SCADA database (accessed from the SCU), and the Block
Database (accessed from the Database Manager).
Creating a SCADA Database
Open the System Configuration program. You can do this through the iFix system tree pane in the workspace under configuration mode. A screen will pop up, looking similar to this:
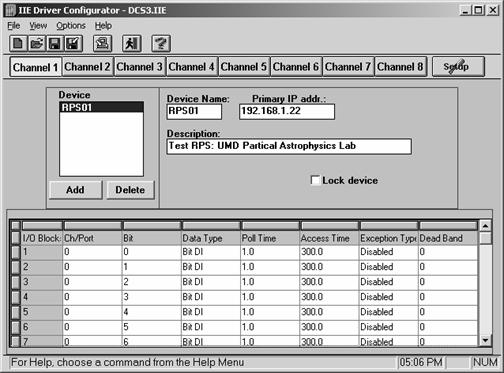
Then, double-click on the IIE icon. Another screen like this will pop-up:
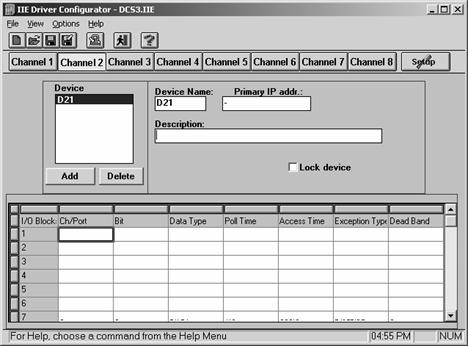
Now, enter the Device Name according to the DCS Naming scheme, along with the respective IP address of the RPS. Also enter a description to translate the naming scheme into English. Once this is done, you can begin entering the SCADA database information.
To enter new information, double-click on any blank row. This pop-up screen will show:

Now, enter an appropriate port/bit assignment in the IO address. Then, select either Bit DI or Port DO for the respective address, under Block Configuration Type. Here are a couple examples:
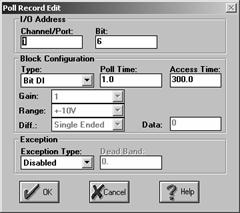
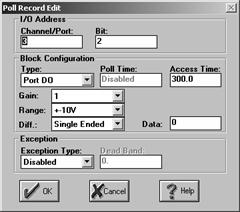
REMEMBER: The Block Configuration type must be correct in order for iFix to receive data. Bit DI for Digital Input, and Port DO for Digital Output.
After all of the I/O addresses have been mapped per the RPS, your final SCADA database should look similar to this:
For multiple RPS boxes, just repeat the previous steps, using different device names. You may have multiple devices on the same channel.
Creating a Block Database
To create a block database, you must first open the Database Manager. Then, create a new block; just double click on any empty cell of the spreadsheet. Configure the identification settings as you wish. The important part is the I/O Address. This address will access the SCADA database. Here is an example of the I/O address: MW01V: d: 1:0. This means that the block will refer to the device named MW01V, a digital input/output, referring to Port 1, Bit 0.
Verifying Communication
You can verify iFix communication by using the Mission Control program and comparing the bits Received, Transmitted, and Timed Out. Obviously, if data keeps timing out there is something wrong and communication has halted. It is normal to see a few timed out bits per a couple thousand transmitted. You only need to worry when bits time out at a consistent rate.
A secondary way of checking communication is by using the Block Database. Once set up, just look at the “current value” field of the spreadsheet, if any are “????” then something is wrong, or the values have just not been updated.
Please refer to the troubleshooting section to solve communication problems.
[Note: If communication is interrupted, the block values
will not change to “????”]
Copying/Transferring iFix Files
Databases: To transfer a database from one computer to another can be tricky if done piecemeal. The I/O configurations for the database tags are stored in the C:\Dynamics\PDB folder with the actual file being node name.IIE ( i.e. C:\Dynamics\PDB\DCS1.IIE’). This file needs to be saved to the other computer first, unless you plan to rewrite the I/O configuration or the name of the node differs between the two computers. The name of the node can be changed using the system configuration utility in iFix, just in case the two node names initially differ and you want to have them match. Copying the .IIE file between computers will make sure that all the IP addresses and naming schemes for the tags do not change, this will allow iFix to properly run any previously configured iFix pictures and databases.
The easiest way to Transfer the database itself is with the ‘import’ function of the Database Manager. Before that, though, the original database needs to be saved as a .CSV file, this will wrap up all the databases periphery files into one place for a seamless transfer between computers or nodes.
1. Save the initial database as a .CSV file.
2. Copy the .IIE file between computers.
3. Use the ‘import’ function in the database manager to import the database, save it to the local computer. The .CSV file will be in the PDB folder of the Dynamics folder.
Pictures:
Pictures can easily be transferred just by copying the picture file into
the Dynamics\PIC directory. ■
Section 6: Using the VME Rack Control System
Map Screen
(Main Control Screen)
The map screen is the warning center for all of the racks on the second level of the MINOS hall. Each type of rack has its own designated color, as represented in the key. Whenever an RPS block is closed, the respective VME Rack on the map will flash in yellow (for warning) or red (for alarm). Clicking on an RPS box will transfer you to the detail screen of that RPS (if in operation). This also applies to the Environmental Monitoring pages (by clicking on the Coil/Env boxes).
At the bottom of the screen there is a listbox, in which block value events will be displayed. So if there is an alarm, you can look in the listbox to find the problem. However, this box will not decode the voltage monitoring bit, so you have to either look at the detail screen for that RPS, or use the Voltage Decoder command button.
After an alarm has been acknowledged by you, is outdated, or no longer needed, right click on the listbox and delete/acknowledge the alarm. Doing so will only make changes in the listbox. There are also many other things you can do with the right-click menu, the functions are self explanatory.
Detail Screen
After selecting the appropriate box on the Map screen, you will be transferred to a device detail screen. This screen displays information and controls regarding an RPS box, each item is described below:
Alarms
§ Voltage Monitor: Indicates whether the voltage channel has deviated beyond acceptable limits.
- Smoke Alarm: Indicates smoke is present within the VME rack, or at least contained in the airflow.
- Airflow In: Indicates airflow intake rate is below acceptable limits.
- Airflow Out: Indicates airflow output rate is below acceptable limits.
- H2O leak: Indicates water is dripping onto the drip sensor within the rack.
- Relative Humidity: Indicates humidity within the rack is over acceptable limits.
- Air temperature: Indicates airflow output temperature is above normal.
- Air temperature difference: Indicates there is a difference, beyond acceptable limits, in temperature between the air input and air output sensors.
- Fan Failure: Indicates a fan, part of the MINOS Fan Pack, has stalled.
Commands
§ Manual RPS Control: Activates the Manual RPS Control Form.
§ Reset RPS: A quick way to reset RPS controls and data values if an event has occurred. This is done by disabling and re-enabling the RPS Control States.
§ Tracer Screen: Opens the Tracer Screen.
§ Map: Opens the Map screen.
§ Help: Opens the help documentation (MINOS VME Rack Guide) via Internet.
RPS Control/Control States
The
§
Output Reset: No updated information will be sent to the iFix
server. Analogous to iFix being blind to
the RPS alarms.
§
Clear Display: Events occurring during this state will not activate the
RPS status lights.
§
Relay Reset: The RPS Relay will re-supply power, and the RPS will not
try to cut power from any event.
§
Alarm Silence: Events that occur during this state will not create an
audible sound with the alarm horn.
§
Smoke Detector Reset: Rack power shuts off, activates alarm as if the
smoke detector is activated. Smoke
detectors will also stop responding to external events until re-enabled.
To
reset these controls, click the Reset RPS command button, or use the
Manual Controls.
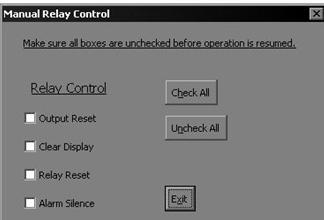
When the Manual Relay Control button is clicked, the following form will be
displayed:
Checking a box will disable the respective Relay Control, unchecking it will re-enable it. You can reset an RPS manually by checking all the boxes, then unchecking them. Unless done intentionally, you should remember to uncheck all the boxes before you close the window, otherwise the control will remain disabled. The consequences can mean a fire without an alarm going off, etc.
Tracer Screen
The
tracer screen is filled with all of the RPS input/output values. There is also a section which decodes the
voltage monitor, also allowing you to see the Voltage Monitor bits truncated in
the same way as the subroutine which does the decoding. This should be self explanatory. ■
Section 7: VNC Tunneling
The DCS control computer is a Win2000 machine. Thus, one must go out of one's way to control it over the network. To make matters more difficult, access to the machine is limited to machines on its own subnet for security reasons. So, one must connect through the minos-gateway machine, which requires kerberos or cryptocard authentication.
Things to have installed on your local machine:
1) The VNC viewer (you don't need a server. In fact, a locally running server complicates things).VNC rpms are available with your RedHat install (perhaps in the "powertools" section if you have an obsolete version of the distribution). VNC debian packages are also available (need details for this though). Or, you can download the source, other flavors of Unix binaries, or the windows client at: http://www.uk.research.att.com/vnc/
2) SSH. If you're sitting at a windows client, there are likely ways to use ssh-enabled terminal emulators (such as putty) to establish the port forwarding. However, I don't know the details. If you know, please add that info to this document. What will work is to install the command line version using the Cygwin package of Unix libraries from: http://www.cygwin.com. Then you can run the real ssh in the same fashion as from a Unix machine. For an overview of tunneling VNC over an ssh connection see: http://www.uk.research.att.com/vnc/sshvnc.html
- First, establish an ssh connection to minos-gateway.minos-soudan.org.
Substitute your minos-gateway account name for username:
ssh -l username -C -g -L
5901:198.124.213.65:5900 198.124.213.3
This establishes a shell login on minos gateway, but also sets up a port forwarding tunnel from your localhost's port 5901 to the DCS machine's 5900, through minos-gateway (the IP address sandwiched between the ports). The -C compresses the datastream, which may or may not speed up your connection.
- Next, run the VNC client software, which opens a window mirroring the
screen on the DCS machine.
vncviewer -encodings
"copyrect hextile" localhost:1
The -encodings "blah blah" option works around a lack of packet compression which happens over the localhost device on Unix machines, you won't need that option on a windows client. Also, on a windows
client you will want to substitute your local machine's name in place of localhost.
- A window will pop up asking for the VNC server's password. This is
currently the standard "numi" account password.
You now have a window mirroring the DCS machine's console. Be nice.
A couple of notes:
The VNC server must be running on the DCS machine for this to work. Currently, this is in a login script, so won't come up until the iFix running account is logged in.
If
more than one person tries to control the console, either via another VNC
session or physically in front of the machine, you will fight for control of
the mouse and keyboard. ■
Section 8: Putty / Plink
Putty is an SSH client for Windows, much like TTSSH or whatnot. Plink is the command line interface for Putty. The reason we use Plink is to connect to Alec’s RPS tools to the iFix interface. You can obtain Putty and Plink here: http://www.chiark.greenend.org.uk/~sgtatham/putty/download.html
After installing Putty and Plink, you must setup a system path variable so you can access plink from any directory you are located in the DOS command prompt. Do the following:
1. Start > Settings > Control Panel > System
2. Advanced tab > Environment Variables
3. Edit the Path system variable to include the directory which contains putty.
4. Click ok and exit.
In iFix, a VBA control is used to create a shell command which opens up Plink which logs into the Unix server and runs a set of commands to access the RPS tools. The VBA command is this:
taskid = shell(“cmd /k plink –ssh user@server.gov -m startup.txt –pw ****”,vbNormalFocuse)
Where: taskid is the windows task id number, this number is returned when this line is executed.
cmd runs the command console.
/k keeps the console open after the command is executed.
plink -ssh runs the ssh client.
-m runs the startup.txt unix script file (this must be located in the dynamics directory).
-pw is the password
vbNormalFocus is how Visual Basic will treat the console
The
unix script file merely switches to the rps directory and runs whatever program
is needed. ■
Section 9: MySQL Integration
To connect iFix to SQL, iFix uses a Windows control called an ODBC driver. An ODBC driver is a chute for Windows to send data, which is then forwarded to a database as specified by the user.
To accomplish this, we must:
1.) Install the MySQL Server.
2.) Create the appropriate database in MySQL Server.
3.) Install MySQL ODBC Driver
4.) Configure the MySQL ODBC Driver
5.) Configure iFix to communicate with the ODBC driver.
6.) Add VisiconX controls to an iFix picture for integration.
Download MySQL Server and the MySQL ODBC driver.
Install/Configure MySQL Server:
MySQL installation is straightforward with all the usual bells and whistles.
To configure the server:
- Run c:\mysql\bin\winmysqladmin.exe
- It will disappear, so in the windows system tray just click on the stoplight and click "showme"
- Click the 'my.ini Setup' tab.
- At the bottom of the textbox you want to modify the username and password like so:
o user = reader
o password = (the numi account password, ask Alec)
o Click 'Save Modification'
- Exit winmysqladmin.exe
Creating the MySQL Server Database:
- Execute the following program: c:\mysql\bin\mysql.exe
- At the prompt type and execute this command:
mysql > create database dcs; use dcs;
- After executing, type "quit" to exit MySQL.
Creating the FIXALARMS Table is done after the MyODBC driver is configured.
Install MyODBC driver:
Installation of MyODBC is straightforward. When the data source popup box shows, click close.
Configure the MyODBC driver:
- Click Start -> Settings -> Control Panel -> Administrative Tools -> Data Sources (ODBC)
The popup window will contain all the ODBC servers for windows. Here you need to make the MySQL data source:
- Click the SYSTEM DSN tab.
- Click 'Add...'
- Scroll down the list and double-click 'MySQL'
- Populate the fields like so:
o Windows DSN Name: DCS SQL Server
o MySQL Hostname: dcsdcp.minos-soudan.org
o MySQL Database Name: dcs
o User: reader
o Password: (numi account password)
- Hit 'ok' to close the pop-up.
- Hit 'ok' to close the ODBC Administrator.
Configuring iFix
- Open the SCU.
- Go to menu: Click 'Configure' -> 'SQL...'
- In the pop-up 'SQL Accounts':
- Click 'Add...'
- Fill in these values:
o Database type: Other
o Username: reader
o Password: (numi account password)
o Database Identifier: DCS SQL Server
o Click 'ok'
- Click 'Configure SQL Task'
o SQL Support: ENABLE
o In the Relational Database Section:
§ Database ID: DCS SQL Server
§ SQL Command Table: SQLLIB
§ Error Log Table: SQLERR
o Click 'ok'
- Click 'ok'
If you want iFix to write tag database information into a separate MySQL table, follow below. If not, just skip to the next section.
- Go to the menu: 'Configure' -> 'Alarms...'
- In the Alarm Configuration pop-up:
o Select ALARM ODBC Service
o Hit the 'Enable' radio button.
o Select 'Modify'
o Select 'Configure'
o Under 'SQL Login Information', make sure 'Use Login Info...' is checked.
o Under 'Database Configuration':
- Check 'Create Table at runtime'
- Check 'Use defaults for table....'
- Click 'Ok' until all the pop-ups are gone.
- Save the SCU file, restart iFix.
Verification
Run the mission controller, and check the SQL log.
Add VisiconX controls to an iFix picture
The VisiconX controls will allow you to retrieve and/or modify the MySQL database info. This section will demonstrate how to retrieve info from the HVTABLE table from the current date and display it in a grid box.
- Create a picture.
-
Add a VisiconX Data Control to the picture.
- Right Click on the new control and select “Properties VisiconXData.vxData Object.”
o For the data provider, select “Microsoft OLE DB Provider for ODBC Drivers.”
- Switch to the database tab.
o Select the DCS MySQL Database as the DSN Name:
o Under database security, use the usual username / password.
- Switch to the Record Source tab.
o Command Type: SQL Command.
o Paste this SQL Command: select * from HVTABLE where HV_TIMESTAMP >= current_date + '00:00:00'
- Add a VisiconX Grid Control to the picture.
o Right Click -> Animations.
o Under the Behavior Tab: Animate the ADO Records property.
o Data Source: SQL.vxData1.ADORecords
o No Data Conversion.
Verification
Simply run the picture. The data should populate the listbox... Yes, it’s just that easy!
Useful SQL Commands
Connecting to the dcs database and viewing table
properties:
gateway> mysql --host=c --user=reader
--password=numi96
mysql> use dcs;
mysql> show tables;
mysql> describe HVTABLE;
+--------------+------------+------+-----+---------+-------+
| Field
| Type | Null | Key |
Default | Extra |
+--------------+------------+------+-----+---------+-------+
| SEQNO
| int(11) | YES | |
NULL | |
| HV_TIMESTAMP | datetime | YES
| | NULL |
|
| MFCDCHAN
| int(11) | YES | |
NULL | |
| GEOMMAP
| int(11) | YES | |
NULL | |
| SETVOLTAGE
| int(11) | YES | |
NULL | |
| READVOLTAGE
| int(11) | YES | |
NULL | |
| ALARMBIT
| tinyint(4) | YES | | NULL
| |
+--------------+------------+------+-----+---------+-------+
7 rows in set (0.00 sec)
mysql> select * from HVTABLE where HV_TIMESTAMP
>= current_date + '00:00:00';
To import a text file into SQL:
mysql> --local-infile <<< RUN THIS COMMAND UPON OPENING THE DATABASE!
mysql> use intellution
Database
changed
mysql> LOAD DATA INFILE "tabledata.txt"
INTO TABLE table_name
> FIELDS TERMINATED BY ',';
<<< FOR COMMA DELIMITATION
Section 10: Troubleshooting
IFix: Software
Symptom: Upon initialization of the Detail Screen, error number: -2147187524 ‘Field’s values unknown’ pops up.
Cause: iFix doesn’t know the initial block values of the
iFix > RPS control blocks.
Solution: Do nothing. The pop up error message is just
an annoyance and there
will be a solution to this in the future.
Symptom: Alarm activates on RPS, but iFix does not
respond.
Cause: Communication failure between iFix and RPS.
Solution(s): It is wise to restart iFix when a
change is made to the communication system (including LAN cables, power, etc).
- Go to the Mission Control program, if data bits time out consistently, then stop the driver, reset the data, and restart the driver. If this doesn’t work, then:
- Reload the SCU, reload the Block Database, terminate and restart iFix. Recheck communication. If it still doesn’t work:
- Terminate iFix, and check communication link through the EDAS Syscheck program and manually send commands to the RPS. If you receive an error message at attempting this, refer to the “Ethernet Data Acquisition System I/O Drivers for the FIX” configuration manual. The second half of the manual contains error codes and possible solutions. If you are still not able to command the RPS:
- Make sure the EDAS board is connected to the LAN, also make sure the computer is plugged into the LAN. Recheck communication.
- Check the three little lights within the EDAS board to make sure the EDAS is working. If none of the three lights blink, there is a hardware problem. Solve hardware problem, then recheck communication.
- If there still is a comm failure, check the configuration settings of the Block and SCADA database. Reboot iFix.
Symptom: The Voltage Monitor Airflow In warning/alarm and Airflow Out alarms are all triggering on IFix but the RPS is not registering any problems.
Cause: The RPS is not talking to IFix.
Solution: Go to the Details page for the RPS and click on the ‘Reset RPS’ button.
Symptom: iFix has a delayed response (over 5 seconds), so does the RPS.
Cause: Data Polling set too high.
Solution: Open the Mission Controller and set the polling rate to 5 centi-seconds.
Symptom: RPS inputs work, but outputs do not.
Cause: SCADA Database has incorrect output data type, most likely ‘Bit DO’.
Solution(s): Change the datatype of all output blocks
so they are ‘Port DO’.
Symptom: iFix halts communication after 24 bits
transmitted.
Cause: Multiple, but most likely Scenario 2.
Scenario 1: Check for the
physical connection between the RPS and the computer, make sure EDAS device on
the RPS has not lost power. Try to ping the RPS using dos or some other
utility. Once the link has been
resolved, you must stop and restart the driver. This can be done using the
Scenario 2: Check the Alarm
History. You may receive an initialization error: cause 28060. This means there
is something wrong with the SCADA database. iFix scans through the SCADA
database, if there is something wrong with any of the data entries of the
database, iFix just gives up all communication for that particular channel. To
solve this problem, make sure all entries of the channel affected are correct,
and are valid entries. An invalid entry will set of a failure.
Symptom: I get error messages when accessing the Manual Control pop-up screen. The error says: “Field’s value unknown.”
Cause: Output fields have not been activated.
Solution(s): You can resolve this by clicking the complete reset button on the Detail screen.
RPS: Hardware
Symptom: The lights on the front of the RPS do not turn on, but the power is turned on and the red light that confirms power to the RPS is lit.
Cause: Blown ¾ amp picofuse on the RPS board.
Solution(s): Pull the ¾ amp picofuse on the RPS board. The first fuse to
test with the DVM is the one closest to the front of the RPS in the right hand
corner. Replace.
Symptom: The Airtemp alarm and warning trigger when there is no sign of the temperature being too high.
Cause: The ¼ amp surface mount picofuse on the airflow out sensor board is blown. Most notably caused by plugging and unplugging the sensors into the RPS while the RPS is powered. ALWAYS unplug the RPS unit before connecting and disconnecting cables and sensors.
Solution(s): The fuse
that is most likely the culprit of this problem is the one nearest the middle
of the sensor board, but just to be sure check the resistance with a DVM to
make sure you get a reading. The fuse is a surface mount so it is a bit tricky
to remove the existing bad fuse and replace it with a good one.